Our Approach
In addition to the coordinate and part-specific information, the database we received also contained on the man-hours needed to resolve the problem. By performing an analysis on the labor hours, we hoped to be able to identify non-conformities that took an abnormally long or short amount of time. These parts could then be flagged to take a second look to ensure that the non-conformity is completely resolved, rather than discovering it later, where it could slow down the service of the aircraft.
To perform the analysis, we required a suitably large subset, which we found in part 2F1-6-42362-119, giving us 70 values to work with. On our initial run, we ran the single column vector of labor hours through the RPCA program, however the results were poor, as RPCA is not optimized for one-dimensional input.
The next step was to create a concatenated four-dimensional array that contained both the three-space coordinates and the labor hours, however this also yield results that appeared skewed, because the program is unable to place more weight on one column than the others. This caused points that were found to be outliers due to their coordinates to be flagged as outliers, even though the man-hours to reconcile the issue were not. Similarly, if a particular non-conformity took an abnormal amount of time to repair but had x, y, z values close to the enough to the others in the subset, it would not be flagged.
To get around this issue we came up with the idea of screening the coordinate’s subset through RPCA to remove points that would already be flagged as outliers against the others. After removing the labor hours from the corresponding row, we then concatenated the two matrices once again and re-ran RPCA. In theory, this additional column of labor-hours would then alter the data and identify outliers that were not present in the three-dimensional pre-sorting process.
Results
Once the pre-screening method, as mentioned above, was implemented, our simulation yielded stronger results than previous attempts. It is, however, important to note that because the data that we are truly interested in is only one-dimensional, our results are heavily influenced by the variances between the individual entries, suggesting that provided an appropriate number of entries, the distribution of a certain part's full set of labor hours should be approximately normal, centered at some mean. In contrast, when organized into a histogram, we found that this was not necessarily the case. As different areas on the plane will be more difficult to access, especially if they are beneath other part(s), leading to an increase in time to completion. The various times involved in actually reaching the part could have contributed the possible skew of the data, which is shown below, resembling a more exponential distribution. If we assume for this part, the mean time to completion is somewhere around the peak, then it suggest that the longer a given non-conformity takes to fix, the more likely it is that it is in a harder to reach location.
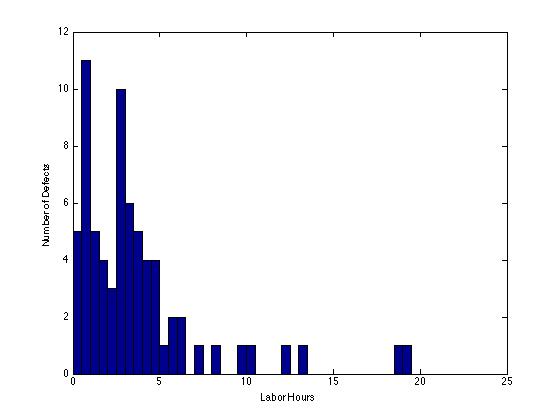
Histogram of Labor Hours for part 2F1-6-42362-119
Another possible explanation is the different stages at which non-conformities are recorded. If a defect is identified before the plane is assembled, it stands to reason that it will take significantly less time to access and fix than if the plane was fully assembled. As the distribution above is bimodal, we can safely conclude that such a bias has been introduced into the sample population.
Although outside the scope of this project, it is possible that a more in depth statistical analysis could yield better results, and could be useful for identifying the those instances where the part is difficult to reach.
